It was the best of forecasts, it was the worst of forecasts.
Let’s look at two heap leach projects to see how their CAPEX forecasts compared to the final constructed cost – who ended up looking like heroes, and who ended up looking like . . . not heroes.
First, let’s examine how the forecasts compare to the actual CAPEX spend for similar constructed heap leach projects. The chart below shows a reference class of completed heap leach projects based on capital dollars per tonne of daily stacking capacity. This metric roughly normalizes the reference class, allowing us to compare projects of different scales. This does not account for unique cost aspects of each project (location, crushing intensity, pre-stripping, and so on), but with a sufficiently large reference class, we can get a good sense of the average and variability in capital spend per unit of production.
The data are presented in a box and whisker plot, where the lower line represents the first quartile (the lower 25% of projects based on unit costs), the shaded middle represents the second and third quartiles (the middle 50% of projects) and the upper line represents the fourth quartile (the highest 25% of project based on unit costs).
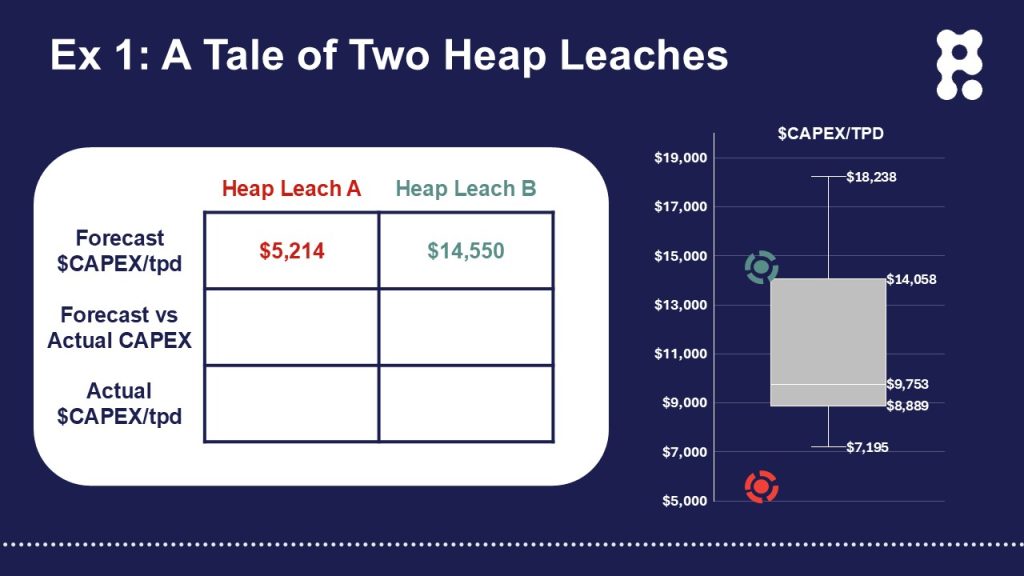
Next, let’s plot how the forecasts at the final investment decision (FID) for these two heap leach projects compare to the refence class on a $CAPEX/TPD basis. All things being equal and in a very general sense, each new mining project that is put into development should be higher in cost than most of the projects that have come before it – otherwise it likely would have already been developed. The chart below shows where each project’s forecast sits relative to the costs at completion for the reference class of similar heap leach projects.
Heap Leach A (in red) projected a $CAPEX/TPD value approximately 30% below the most capital-efficient heap leach operation in this reference class. It is possible that unique project attributes or circumstances placed this project in a fundamentally lower-cost position than any comparable project – this exercise certainly raises that question based on the forecast’s relative position. Absent a coherent and defensible explanation, Heap Leach A appeared to carry a high risk of significant cost overrun relative to its CAPEX forecast at FID.
Heap Leach B, on the other hand, projected a low fourth-quartile $CAPEX/TPD value, placing it toward the conservative end of cost expectations. Based on its relative position in the reference class, Heap Leach B appeared to carry a lower risk of significant cost overrun.
Now, let’s see what actually happened.
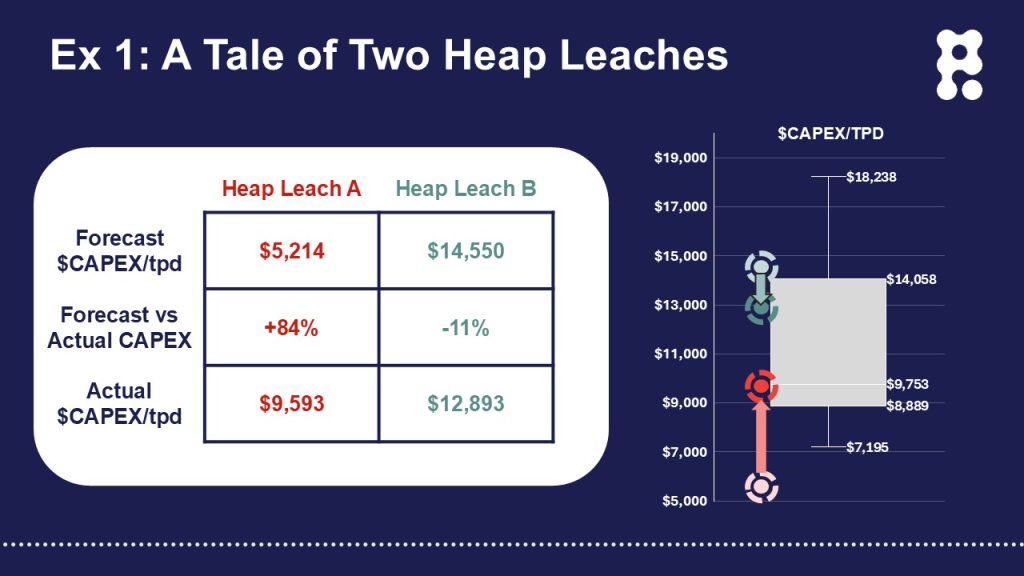
Heap Leach A ultimately landed almost exactly at the median value for $CAPEX/TPD and achieved a 25% lower $CAPEX/TPD value than Heap Leach B. However, Heap Leach A overran its CAPEX forecast by 84%, while Heap Leach B came in 11% under budget. Despite being constructed for a completely reasonable capital cost relative to the reference class, Heap Leach A was widely considered a significant failure. (I’m not going to disclose the project name, but many news articles were written about the “failure” of this project). In contrast, Heap Leach B was viewed as a clear success and a marquee example of this company ability to execute projects on time and on budget.
Both forecasts were created by teams of professionals and for serious companies with hundreds of millions of dollars at stake. So, what went wrong with Heap Leach A and what went right with Heap Leach B?
Knowing the details of the forecast, execution phase, and final constructed cost for Heap Leach A, I feel confident in saying that it was never going to be successfully constructed within the original CAPEX budget. Several critical underlying assumptions proved to be incorrect, although they could have been validated during the planning phase. The forecasted infrastructure scope was inadequate and expanded multiple times during execution. Most significantly, I do not believe the project was economically viable at a realistic capital cost. A CAPEX budget was created that made the economic model look attractive and once approved, the train left the station.
In contrast, the economics for Heap Leach B were robust even at a conservative capital cost, and that was carried through in the forecast. It’s not so much that things went right, but rather that exceptional performance in mining (and megaprojects in general) often reflects the absence of significant mistakes or misfortune. Setting and achieving conservative targets routinely results in world-class project and company performance in the mining industry.
This comparison is meant as a cautionary tale. Applying this kind of Reference Class Analysis can guard against gross forecasting errors and is useful throughout the project hierarchy. Project funders or approvers can use it as a sanity check on project concepts and economic models. Project executives can use it to evaluate the degree of optimism or pessimism embedded in a forecast. And project execution teams can use it to see whether they’ve been handed – putting it very politely – a set of assumptions and expectations they have no hope of achieving.
As Sydney Carton walks to the gallows at the close of Dickens’ A Tale of Two Cities, the power of the moment lies not in triumph but in the quiet conviction that he has done the right thing. For project owners and teams who have taken the time to build and validate a realistic forecast, there can be a similar sense of reassurance. Clear-eyed forecasting does not guarantee an easy journey, but it does offer confidence that decisions were made with care, discipline, and integrity. In that spirit, Carton’s final words resonate: “It is a far, far better thing that I do, than I have ever done; it is a far, far better rest that I go to than I have ever known.”